Since my last bike-commute, I bought and installed a Garmin Edge 705 cycling computer that is GPS-enabled and with a heart rate monitor and cadence-speed sensor. For further product information:
- The Garmin sales site offers the basic device+HR for $500, +HR+cadence at $550, +HR+cadence+topo at $600, and +HR+cadence+street at $650.
- I purchased my device at a 40% discount at Amazon.com. I researched lower prices considerably, and one site had a lower price, although they had no 705s in stock.
- I'm able to use the device without maps for now, since my riding is in familiar territory.
- I'm looking for the best deals on mapping to load to the device. Since I plan to use the device in Ohio, Indiana, Kentucky, California, and perhaps Arizona and Pennsylvania, the mapping may become fairly expensive.
- Selecting the mapping add-ons is likely the most complex part of using the device, with options for road riding, trail riding, and geographic location.
- Setup took an evening, including charging the main device, setting up an online account for keeping statistics on my rides, setting up the main device, installing the device mounts on two bikes, and figuring out the mounting of the cadence sensor.
- I'm having trouble for the moment installing the cadence-speed sensor on my Trek hybrid, because the sensor doesn't seem to span the distance between the cadence magnet on the crank arm and the speed magnet on a rear-wheel spoke. I've contacted Garmin support online, which promised a reply in 3 days. This is the 2nd day of waiting for the reply. —There's no such trouble for the cadence-speed sensor on my Lotus fixed-gear. The trail bike may have a similar problem.
The cyclometers always failed first in the cabling. As the cabling on each bike successively failed, I thought then that keeping track of ride statistics was just giving in to a tendency toward obsessive-compulsive activity. I counteracted by giving in to inertia, and decided not to fulfill either a need or a desire to repair the computers.
But I've missed the statistics, and I've been ready to feed my OCD for some time. Back when the first cyclometer failed, wireless devices were beginning to be available, but they were pricey. Like all technology, prices have been coming down while features were piling on. Since last Autumn, when I decided it was time to upgrade to a wireless cyclometer, I've been searching out and comparing the many brands and models available. I finally decided on the Garmin 705 when I found it available at steep discounts that made its price more competitive with other brands that had fewer features.
Today's ride now is documented thoroughly with little effort. Before today, I kept refreshing the list of timings, memorizing them as I rode from home to work and from work to home. But today's ride had no memory work, other than the reminder to press LAP as I passed each established checkpoint. I could focus instead on whether I was really pushing the edge of what I could do, since I had set an alarm to indicate when my heart beat below 136 bpm or above 167 bpm. (I never heard that "too high" alarm today. Gotta find out what it sounds like some day soon.)
Then, at my desk after a shower, I plugged in the USB cable from the 705 to my computer, accessed my account at Garmin's site, and downloaded the commute data. The data crunching is instantaneous and immediately understandable.
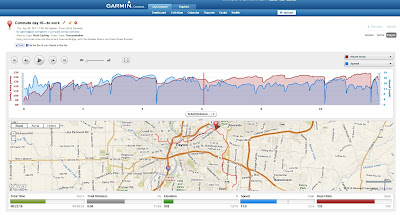
Route with charts of all statistics and graphs of speed, elevation, and heart rate along an axis of time. You can also display the graphs of speed, elevation, and heart rate along an axis of distance or timed movement (tosses out those seconds or minutes spent at stop lights).
Chart of split statistics.
Route with a graphed comparison of speed and elevation. A playback of the entire ride moves red markers through the chart and through the route, while the momentary readings of time, distance, elevation, speed, and heart rate vary at the bottom.
Route with a graphed comparison of speed and heart. A playback of the ride is also available here.
Ride conditions
Temperature: 45 to 48°F at 07:50, 52 to 55°F at 11:00
Precipitation: none
Winds: 10 to 15 mph, gusts to 20 mph from the south
Clothing: 2-layer top, 1-layer bottom; ankle socks. Open-finger gloves.
Bike: Trek 850
Time: 00:46:26 for 11.94 miles
Bikeway users: 2 pedestrians, 1 dog
1st Garmin day


No comments:
Post a Comment